
| Seminar | Title | Duration |
|---|---|---|
| INTRO | Introduction to STATGRAPHICS Centurion | 3 hours |
| BASIC | Basic Descriptive Statistics | 3 hours |
| ANOVA | Analysis of Variance and Multivariate Methods | 3 hours |
| REGRESSION | Regression Analysis | 3 hours |
| DOE1 | Design of Experiments - Part 1 | 3 hours |
| DOE2 | Design of Experiments - Part 2 | 3 hours |
| SPC1 | Statistical Process Control - Part 1 | 3 hours |
| SPC2 | Statistical Process Control - Part 2 | 3 hours |
| TIME | Time Series Analysis and Forecasting | 3 hours |
| VISUALIZE | Data Visualization | 3 hours |
INTRO: Introduction to Statgraphics Centurion
Getting Started
The Main Statgraphics Window
Observations and Variables
Opening a Data Source
Analyzing the Data
Saving the Session in a StatFolio
Running Statistical Procedures
Data Input Dialog Boxes
Printing Analysis Windows
Copying Tables and Graphs to Other Applications
Using the StatReporter
Using the StatGallery
Using the StatAdvisor
Setting System Preferences
Manipulating Data
Creating New Variables
Variable Transformations
Data Generators
Sorting Data
Recoding Data
Exploring Data with Dynamic Graphs
Graphics Profile Designer
Point Labeling
Jittering
Brushing
Zoom and Pan
3D Rotation
Using the Response Surface Explorer
Creating Videos
BASIC: Basic Descriptive Statistics
One Sample Analysis
Summary Statistics
Frequency Tabulations
Frequency Histograms
Percentiles
Quantile Plot
Normal Probability Plot
Stem-and-Leaf Display
Box-and-Whisker Plot
Confidence Intervals
Hypothesis Tests
Outlier Identification
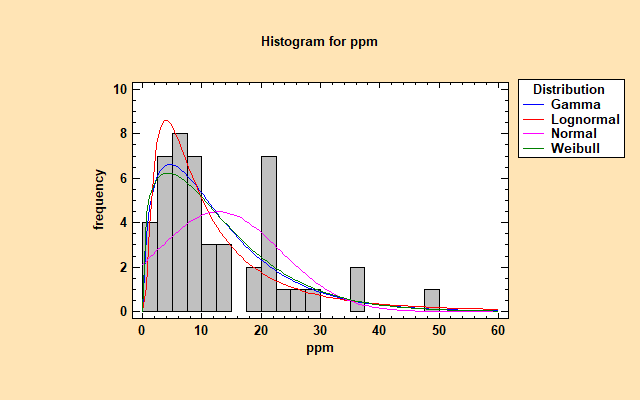
Distribution Fitting
Tests for Normality
Selecting Alternative Distributions
Goodness-of-Fit Tests
Probability Distribution Plots
Tail Areas
Critical Values
Transforming Data to Achieve Normality
Sampling Distributions
Simulation
Generating Random Data
Monte Carlo Simulation
Comparing Two Samples
Comparison of Standard Deviations
Comparison of Means
Comparison of Medians
Multiple Box-and-Whisker Plots
Quantile-Quantile Plots
Paired Sample Comparisons
Nonparametric Tests (Sign text, Wilcoxon test)
Sample Size Determination
One Sample Analysis
Comparing Two Samples
Analysis of Attribute Data
Tabulation
Crosstabulation
Confidence Intervals and Tests for Binomial Distributions
Contingency Tables
Chi-square Tests
ANOVA: Analysis of Variance and Multivariate Methods
Oneway ANOVA
Summary Statistics
ANOVA Table
Means Table
Means Plot
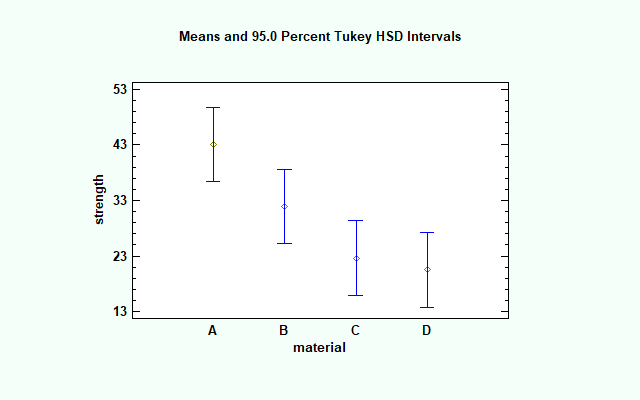
Multiple Range Tests
Variance Check
Residual Plots
Nonparametric Tests (Kruskal-Wallis)
Sample Size Determination
Multifactor ANOVA
ANOVA Table
Means Plot
Interaction Plots
Multiple Comparison Procedures
General Linear Models
Multivariate Methods
Principal Components Analysis
Cluster Analysis
Discriminant Analysis
Correspondence Analysis
REGRESSION: Regression Analysis
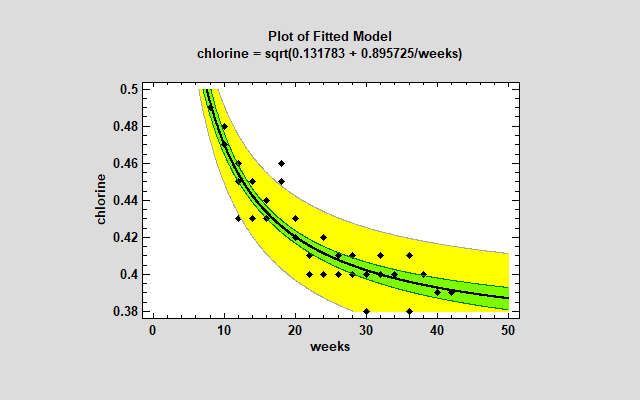
Curve Fitting
Fitting a Straight Line
Plotting the Fitted Model
Regression Statistics
Lack-of-Fit Tests
Selecting a Nonlinear Model
Analyzing Residuals
Multiple Regression
Model Specification
Regression Analysis Table
Stepwise Variable Selection
Analysis of Binary Data
Logistic Regression
Probit Analysis
Advanced Regression
Fitting Calibration Models
Generating All Possible Regressions
Comparing Regression Lines
Orthogonal Regression
Using the General Linear Models Procedure
Box-Cox Transformations
Weighted Regression
Classification and Regression Trees (CART)
Cross-Validation
Ordinal Regression
DOE1: Design of Experiments Part 1
Constructing an Experimental Design
Step 1: Define the Response Variables
Step 2: Define the Experimental Factors
Step 3: Select a Design
Step 4: Specify a Statistical Model
Step 5: Select Runs
Step 6: Evaluate Design Properties
Step 7: Save Experimental Design
Analyzing an Experimental Design
Step 8: Fit the Statistical Model
Step 9: Optimize the Response Variables
Step 10: Save the Results
Augmenting Designs
Step 11: Add Additional Runs
Step 12: Extrapolate Beyond the Experimental Region
Screening Experiments
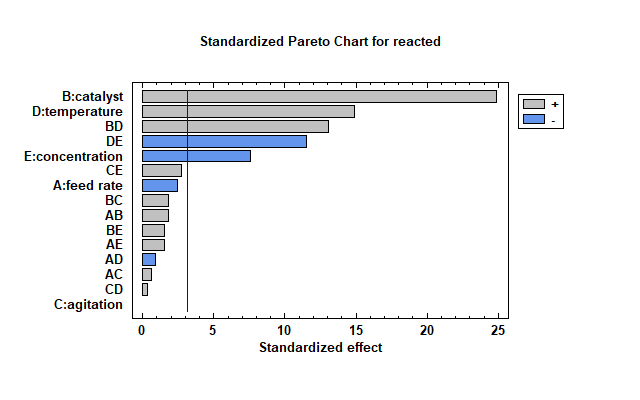
Factorial Designs
Fractional Factorial Designs
Plackett-Burman Designs
Taguchi Inner and Outer Arrays
Definitive Screening Designs
DOE2: Design of Experiments Part 2
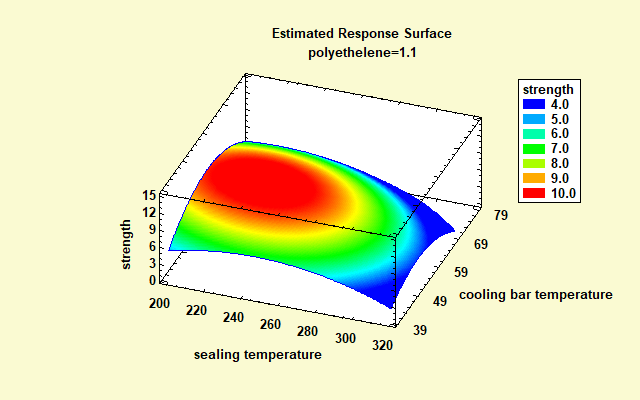
Response Surface Experiments
Central Composite Designs
Three-level Factorials
Box-Behnken Designs
Draper-Lin Designs
Mixture Experiments
Mixture Models
Simplex-Lattice and Simplex-Centroid Designs
Extreme Vertices Designs
Analyzing Mixture Experiments
Multiple Response Optimization
Constructing Desirability Functions
Generating Overlay Plots
D-Optimal Designs
Generating Candidate Runs
Selecting the Optimal Subset
Using D-Optimal Designs to Fix Botched Experiments
Robust Parameter Designs
Robust Operating Conditions
Control Variables and Noise Variables
Using Taguchi's Orthogonal Arrays
Using Montgomery's Combined Designs
Variance Component Designs
Nested Factors
Estimating Variance Components
Power and Sample Size Determination
SPC1: Statistical Process Control Part 1
Summarizing Data
Run Charts
Multiple Variable Analysis
Basic Control Charts
X-Bar and R Charts
X-Bar and S Charts
Individuals Charts
Control Charts for Non-Normal Data
Attributes Charts (p, np, U, C)
Rare Event Charts (T, g)
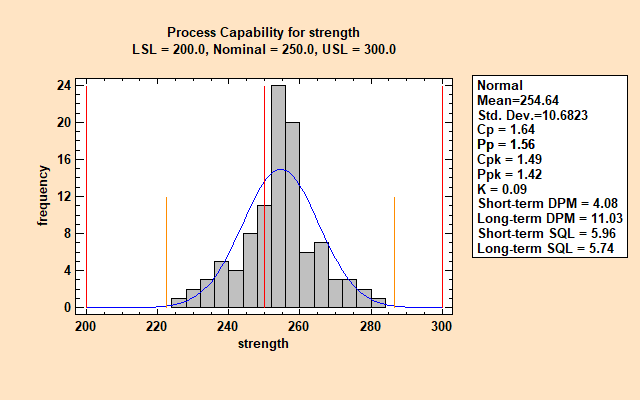
Process Capability Analysis
Capability Analysis for Variables
Selecting the Proper Distribution
Estimating DPMO
Estimating Capability Indices
Calculating the Sigma Quality Level
Non-Normal Capability Indices
Tolerance Limits
Statistical Tolerance Limits
Normal Tolerance Limits
Tolerance Limits for Lognormal and Weibull Distributions
Nonparametric Limits
Sample Size Determination
Capability Analysis for Attributes
Defects (binomial and hypergeometric)
Defects per Unit (Poisson and negative binomial)
Pareto Analysis
Pareto Charts
Cumulative Pareto Charts
SPC2: Statistical Process Control - Part 2
Gage Repeatability and Reproducibility
Setting up a Standard Study
Average and Range Method
ANOVA Method
Short Studies
Destructive Tests
Gage Studies for Attributes
Setting Up a Standard Study
Estimating R&R
Interrater Comparisons
Advanced Control Charts
EWMA Charts
Acceptance Control Charts
Multivariate Control Charts
Life Tables
Life Tables for Interval Data
Life Tables for Failure Times
Survivor and Hazard Functions
Kaplan-Meier Estimates
Distribution Fitting with Censored Data
Maximum Likelihood Estimation
Selecting the Proper Distribution
Weibull Analysis
Life Data Regression Analysis
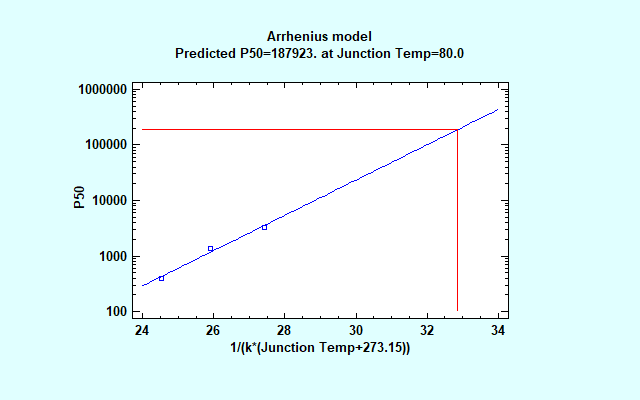
Accelerated Life Tests
Arrhenius Plots
Fitting Parametric Models
Cox Proportional Hazards Models
TIME: Time Series Analysis and Forecasting
Descriptive Methods
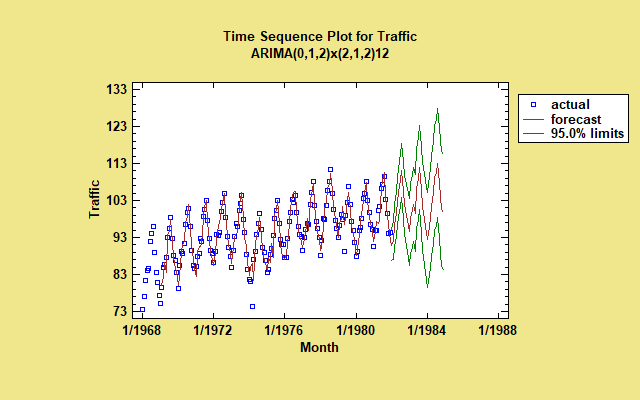
Time Sequence Plots
Autocorrelations
Partial Autocorrelations
Periodograms
Tests for Randomness
Cross-correlations
Smoothing
Moving Averages
Exponential Smoothers
Nonlinear Resistant Smoothers
Seasonal Decomposition
Classical Decomposition
Trend-Cycle
Seasonal Indices
Irregular Component
Seasonally Adjusted Data
Seasonal Subseries Plot
X-13ARIMA-SEATS Seasonal Adjustment
Forecasting
User-Specified Models
Trend Models
Moving Averages
Exponential Smoothers
ARIMA Models
Automatic Forecasting
VISUALIZE: Data Visualization
Visualizing Numeric Data
Matrix Plot
Bubble Chart
Box-and-Whisker Plot
Violin Plot
Diamond Plot
Radar/Spider Plot
Glyphs
Visualizing Categorical Data
Barchart, Piechart and Donut Chart
Dashboard Gage
Tornado/Butterfly Plot
Mosaic Plot
Likert Plot
Visualizing Time Series Data
Run Chart
Waterfall Plot
Component Line Chart
High-Low-Close Plot
Time Series Baseline Plot
Visualizing Statistical Models
Surface and Contour Plots
Heat Maps
Trellis Plots
Response Surface Explorer
Visualizing Spatial Data
Creating Maps
Kriging
Dynamic Data Visualization
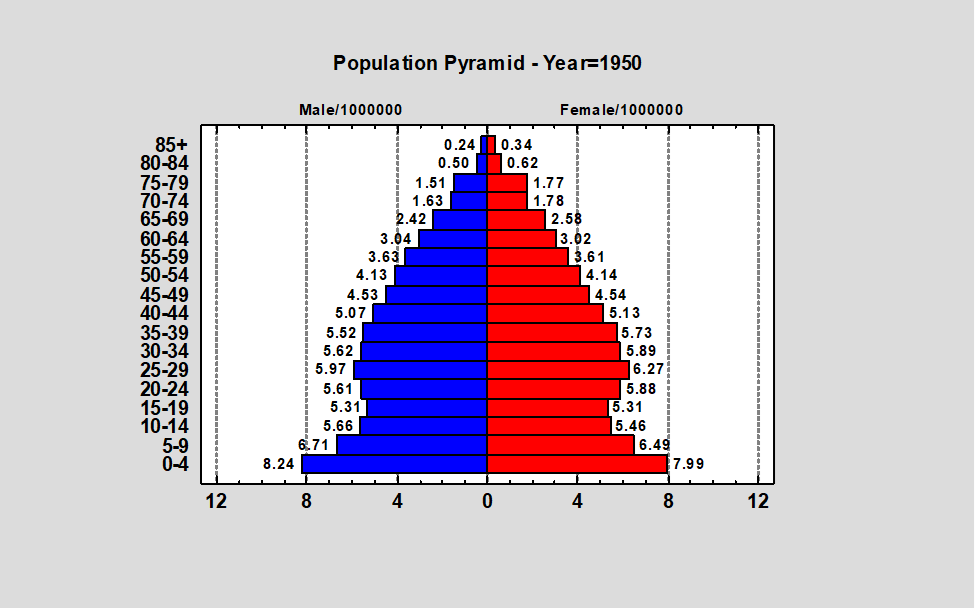
Population Pyramid
Windrose Diagram
Deviation Dashboard
Candlestick Plot
Dynamic Pareto Chart
Time Series Spiral Plot
Sunflower Plot


© 2023 Statgraphics Technologies, Inc.
The Plains, Virginia
CONTACT US
Have you purchased Statgraphics Centurion or Sigma Express and need to download your copy?
CLICK HERE


