
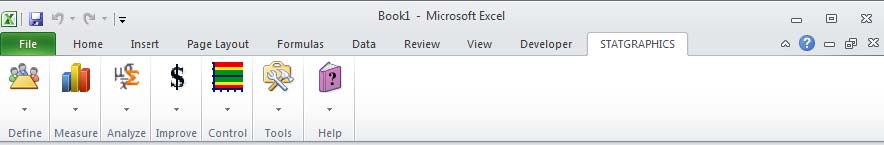
STATGRAPHICS Sigma express is an "add-in" for Microsoft Excel that enables users to perform various calculations required when learning or applying Six Sigma by using Six Sigma analysis tools. It adds a menu selection for Six Sigma in Excel containing sections for each item of the DMAIC paradigm (Define, Measure, Analyze, Improve and Control) plus additional menu items for Tools and Help. The contents of Sigma express are sufficient to cover the needs of green belts and many black belts for performing Six Sigma calculations in Excel. In addition, Sigma express is similar enough to STATGRAPHICS Centurion that users can easily upgrade to that product if they need additional statistical capabilities.
.jpg)

| Excel versions supported | Excel 2003, 2007, 2010, 2013, 2016 |
|---|---|
| Operating systems | Windows XP, Windows Vista, Windows 7 & 8 (32-bit and 64-bit), Windows 10 |
| Language | English, French |
| Price | $495 for single-user license |
| Site license | Please contact us. |
| Graphics interface | All graphics features may be changed interactively with this Six Sigma Excel software. Supports added text, point labels, zoom and pan, interactive 3D rotation, brushing, jittering. |
| Special features | StatAdvisor interprets statistical results in plain language. Statlets allow interactive manipulation of procedure options with immediate execution. |
| User Guide | Click here. |
Six Sigma Excel data is selected by first highlighting it in your Excel worksheet. Specific columns are then selected through a standard STATGRAPHICS data input dialog box. Results are displayed in Sigma express by opening a STATGRAPHICS analysis window with multiple panes for tables and graphs. Users interact with the Six Sigma Excel graphs in the same way as in STATGRAPHICS Centurion. When satisfied with the output, it may be pasted back into the worksheet for Six Sigma calculation in Excel or into another application such as Word or PowerPoint.
 |
QFD Matrix, Cost of Quality Trend Analysis, Process Mapping, Affinity Diagram |
 |
FMEA, Priority Matrix, Scatterplots, Frequency Histograms, Box-and-Whisker Plots, Normal Probability Plot, Run Charts, Sample Size Determination, Gage R&R |
 |
One Variable Analysis, Probability Plots, Statistical Tolerance Limits, Distribution Fitting, Power Transformations, Hypothesis Tests, Outlier Identification, Comparison of Two Samples, Comparison of Multiple Samples, One-Way ANOVA, Multifactor ANOVA, Simple Regression, Curve-Fitting Statlet, Multiple Regression, Surface-Fitting Statlet, Process Capability Analysis, Tabulation, Frequency Tables, Pareto Chart, Crosstabulation, Contingency Tables |
 |
Cause-and-Effect Diagram, FMEA, Create Experiment (screening and response surface designs), Analyze Experiment |
 |
Individuals Charts, X-Bar and R Charts, X-Bar and S Charts, Median and Range Charts, P Chart, NP Chart, U Chart, C Chart, MA Charts, EWMA Charts |
 |
Monte Carlo Simulation, Probability Distributions, Sampling Distributions, Six Sigma Calculator, System Preferences, Graphics Profile Designer |
 |
Procedure documentation, guide to Getting Started with Six Sigma in Excel |

© 2023 Statgraphics Technologies, Inc.
The Plains, Virginia
CONTACT US
Have you purchased Statgraphics Centurion or Sigma Express and need to download your copy?
CLICK HERE


