STATBEANS®

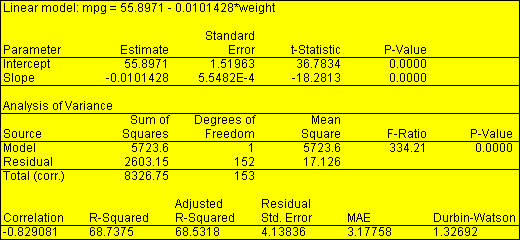
STATBEANS® is a collection of JavaBean data-analysis add-ins which implement many commonly used statistical procedures. What are JavaBeans? In this case they data analysis add-ins that are designed to be embedded in user-written applications or placed on web pages. Because of their structure as a component library, they may be easily manipulated in various visual development environments. Users have a choice of accessing STATBEANS® as JavaBeans examples or as ActiveX components using the JavaBeans-ActiveX bridge.

Types of STATBEANS® For Data Analysis
There are four basic types of STATBEANS® as JavaBeans examples:

statdatasource32 DataSource STATBEANS® - These JavaBeans examples maintain a rectangular data table which other STATBEANS® access to retrieve data for analysis. DataSource STATBEANS® are provided for reading data from local text files, for reading data over the Internet or local intranets, for accessing databases via JDBC, and for maintaining data generated by user programs.

samplestatistics32 Calculation STATBEANS® - These are non-visible beans which perform statistical calculations. They may be called by user programs to calculate statistics. They are also accessed by the tabular and graphical STATBEANS®.

statisticstable32 Tabular STATBEANS® - These are JavaBean examples that perform statistical calculations and display them in the form of tables.

xyplot32 Graphical STATBEANS® - The STATBEAN® data-analysis add-ins perform statistical calculations and display them in the form of graphs. Users create applications by first adding what are JavaBeans' datasources along with the STATBEANS® to their project, and then linking the other STATBEANS® to the datasource.

Application Development

STATBEANS® may be included in both applets and applications. Using STATBEANS® in a project requires the following steps:

  • STEP 1: Add a datasource STATBEAN to the project and set its properties. For example, to read a file, you would insert the FileDataSource bean into your project and set the fileName property to the name of the file you wanted to read.
  • STEP 2: Add a Calculation STATBEANS to the project and set its properties. For example, to fit a straight line relating two columns of data in the datasource named "mpg" and "weight", you would insert the SimpleRegression bean into your project, and then set the XVariableName property and YVariableName property to the names of the columns to be analyzed. 
  • STEP 3: Add one or more Tabular and Graphical STATBEANS to the project and set its properties. For example, to display the results of Step 2, you would insert the SimpleRegressionTable and SimpleRegressionPlot beans into your project.
  • STEP 4: Connect the SimpleRegression bean to the FileDataSource bean. Also connect the SimpleRegressionTable and SimpleRegressionPlot beans to the SimpleRegression bean. This is done by selecting the target StatBean and making it a listener for the datasource STATBEAN'S dataChange event.
  • STEP 5: Instruct the FileDataSource bean to read its data. When the applet or application is run, it creates the four STATBEANS. The FileDataSource bean reads the data file and stores the data in an invisible rectangular table. When the readData() function is executed, it fires its dataChange event, which causes the SimpleRegression bean to request data from the datasource bean and calculate the desired statistics. The SimpleRegression bean then fires its dataChange event which causes the SimpleRegressionTable and SimpleRegressionPlot beans to update their displays.

When the applet or application is run, it creates the four STATBEANS®. The FileDataSource bean reads the data file and stores the data in an invisible rectangular table. When the readData() function is executed, it fires its dataChange event, which causes the SimpleRegression bean to request data from the datasource bean and calculate the desired statistics. The SimpleRegression bean then fires its dataChange event which causes the SimpleRegressionTable and SimpleRegressionPlot beans to update their displays.

Installation

STATBEANS consists of a collection of components which are packaged in a file called statbeans.jar. To install it:

  1. Place the jar file in a new directory called statbeans.
  2. Update the CLASSPATH environment variable to include statbeans\statbeans.jar.
  3. Import the jar file into your application development tool, if desired.

There are a number of other useful files distributed with the package:

Documentation files - the documentation for STATBEANS consists of a set of html files providing an overview of the system and describing each STATBEAN.

Sample applications - sample java source files showing how each STATBEAN may be used. These examples demonstrate both how to use the STATBEAN with data generated by an application and how to hook them to external data files and databases. Several sample data files are also included.

Examples

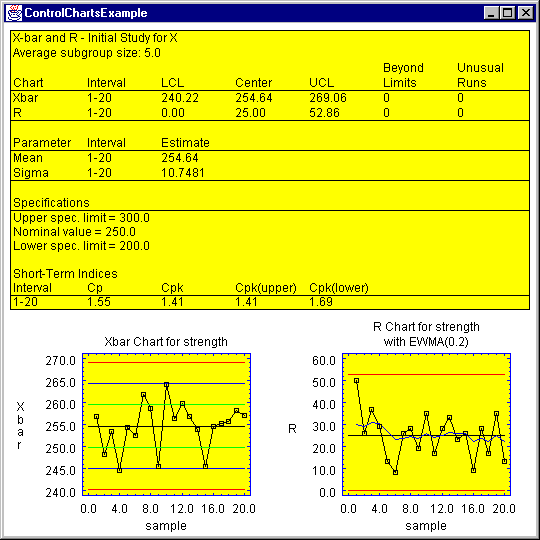
STATBEAN or JavaBeans examples are included throughout this section. In addition, sample java files are distributed with the system which implement each STATBEAN as a simple Java application. The data-analysis add-in sample files have names such as ControlChartsExample.java, which creates the following output:

simpleregressiontable(1)
 
A typical example of the output that can be created is shown below:


Notes

Some special features and other items of note are:

  1. Each STATBEANS lists various Read/Write Properties. The properties may be read or set by capitalizing the first letter of the property and adding one of the following suffixes to the front:
"set" to read the value of any property, as in simpleRegression1.setModelType("Exponential").
"get" to read the value of any property except a boolean, as in simpleRegression1.getSlope().
"is" to read the value of a boolean, as in simpleRegression1.isIncludeConstant().
 
The Other Public Methods are called exactly as listed.
  1. Calculation STATBEANS save intermediate results in the Output Variables listed. The calculation StatBean then serves as a datasource to other beans, adding these output variables to the variables of its input datasource. A good example of this feature is contained in the file XYPlotExample2.java, which uses the XYPlot STATBEAN to plot residuals from a simple regression.
  2. Most Calculation STATBEANS require the input of column names to specify the data to be analyzed. In place of a simple name such as "weight", you may specify instead a transformation of a column by entering a string such as "LOG(weight)". The transformations currently supported are: natural logarithm - LOG(weight) square root - SQRT(weight) cube root - CBRT(weight) absolute value - ABS(weight) exponential function - EXP(weight) raise to a power - weight^1.5 Full algebraic parsing will be added at some point in the future.


Trademark and Copyright Notification

STATBEANS® is a trademark of Statpoint Technologies, Inc. All rights reserved. All STATBEANS® code and documentation is copyright 2015 by Statpoint Technologies, Inc., and is not to be redistributed without express written permission.